TaurusTrend User’s Interface
The TaurusTrend widget is the standard way for Taurus applications to
graphically show the evolution of one or more scalar attributes from the control
system.
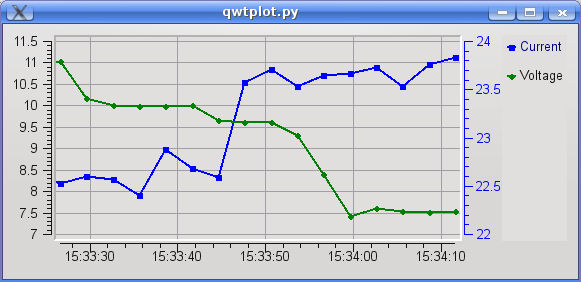
The value of the scalar attributes is plotted in a Y axis with incrementing X value each time an event from this attribute is received. The X values can either be an index for the event number or a timestamp value. See Timestamp VS “event number” mode for more details.
TaurusTrend is based on TaurusPlot, and shares all its features. Please
check the TaurusPlot User’s Interface Guide for learning about
them. In the following, only those features that are exclusive of TaurusTrend are
discussed.
TaurusTrend as a stand-alone application
You may also use TaurusTrend as a stand-alone application for showing trends of attributes from the control system. You can launch the stand-alone TaurusTrend with the following command:
taurustrend [options] [<model_list>]
Run the following command for more details:
taurustrend --help
The model list is optional and is a space-separated list of models for TaurusTrend.
Valid models are: SCALAR or SPECTRUM attribute names or alias (spectra will be treated
as collections of scalars). See TaurusTrend API for more information about valid models
Timestamp VS “event number” mode
When TaurusTrend receives an event from an attribute, it plots the attribute value against either:
- the sequential order of arrival of the event (i.e., the event number), or
- the timestamp associated with this value. See Date/time support for more information.
When TaurusTrend is part of a GUI, this behavior is set by that GUI. If TaurusTrend is used as a stand-alone application, the behavior is determined by the -x parameter (see the TaurusTrend as a stand-alone application section).
The timestamp mode is in general the most used one, but it is important to be aware that the timestamp will only be as accurate as the (distributed) control system allows (not all attributes will, typically, be controlled by a centralised high-accuracy clock). See the Known limitations section for more details.
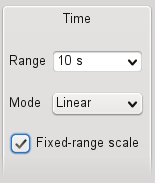
The Fixed-range X scale
When working with trends, you may want to see the latest changes only. For example, you may be interested in seeing the changes occurred within the last 5 minutes (assuming you are working in time scale) or only the latest 20 values (if you were working in “event number” mode).
You can switch the Fixed-range X scale mode on and off from either:
The Context Menu (under the Scales submenu)
The Plot Configuration dialog (under the X axis/Time section). Here you can choose from suggested values or simply type a range:
- If working in Time mode, the range consists of a number followed by one of the following time units: “s”, “m”, “h”, “d”, “w” and “y”. See Date/time support for more information.
Note that if you switch the Fixed-range mode from off to on, the current range of the X axis (Max-Min or End-Start) will be used.
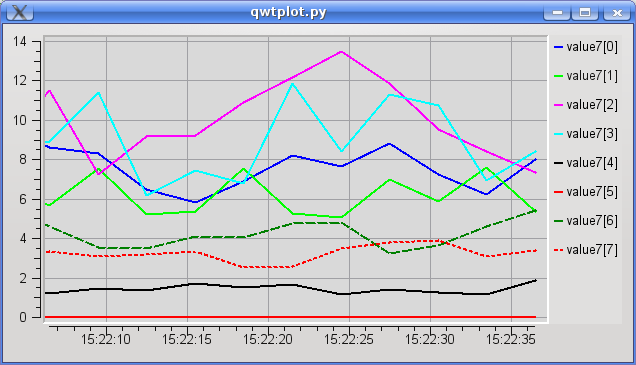
Using a spectrum as a collection of scalar values
TaurusTrend plots the evolution of scalar values. However, in many occasions the SPECTRUM attributes are (ab)used in the control system as a way of packing a set of scalar values together.
For this reason, TaurusTrend allows you to plot trends of SPECTRUM attributes assuming that each item in the spectrum is an independent scalar number (e.g., a SPECTRUM of length 8 will be plotted as 8 separate curves).
Obviously, all curves related to a single SPECTRUM attribute will be updated simultaneously, since events are received per attribute.
Accessing archived values
TaurusTrend supports connecting to a Database of archived values for the parameters being plotted, which allows to access values previous to the moment the GUI trend was created.
To improve performance, this feature is not enabled by default but it can be enabled in the Context Menu. If launching the TaurusTrend as a stand-alone application, you can also enable this at launch time by passing the -a option (see the TaurusTrend as a stand-alone application section).
Important: retrieving archived values can be slow. Even if archived values are accessed only when needed (i.e., when the time range being displayed requires it), you may experience performance issues if you change the scale to include large time range. For this reason a warning dialog may be shown when you try to access too much archived data.
Polling buffer
The Tango control system provides a buffer of the last values read for an attribute. This can be useful sometimes for performance reasons. The Polling Buffer support in TaurusTrend can be enabled in the Context Menu.
Forced read of attributes
Some attributes of the control system may be set to only send events when their value changes. In the case of TaurusTrend, this behaviour causes that attributes that do not change often, do not get new points in the trend and thus may seem to have been “lost”. To avoid this issue, you can instruct the TaurusTrend to periodically force re-read the attributes being displayed. You can enable this feature (and set the re-read period) from the Context Menu.
If launching the TaurusTrend as a stand-alone application, you can also enable this at launch time by passing the -r option (see the TaurusTrend as a stand-alone application section).
Keep in mind the following:
- When enabling this feature, TaurusTrend will ignore all other events (to guarantee that the refresh occurs at and only at the desired periodic times).
- Setting very frequent re-reads may impact your control system and GUI performance. Specially if you are plotting several attributes. So, do not use this feature unless it is really needed
Known limitations
Limited timing precision when comparing two attributes
If two different attributes are plotted in the same trend, their times may appear slightly out-of-synch. For example, two parameters that are known to vary simultaneously may be apparently 0.5 seconds apart.
This occurs because TaurusTrend relies on the control system timestamps for assigning the time values. Therefore, its precision is limited by that of the control system for the given parameters.
Note that timestamps for an attribute may be assigned using the internal clock of the machine hosting the device server. Therefore, attributes managed by different machines may only be compared to the extent of the synchronization of the corresponding internal clocks. In such a case, keeping all machines synchronized is highly recommended (e.g., using NTP, accuracy should not be worse than 0.1s).
Spectrograms (2D trends)
The TaurusTrend2DDialog widget is the standard way for Taurus
applications to graphically show the evolution of a one-dimensional
attribute. The representation is done as a spectrogram: the time (or
event number) is represented in the X axis while values of the array
are color-coded along the Y axis.
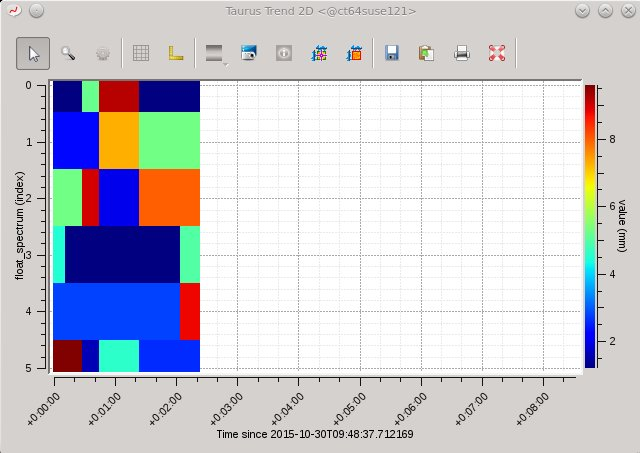
Several tools from the standard guiqwt toolkit for images are available, and zooming and panning are possible using the standard mechanisms of guiqwt.
The TaurusTrend2DDialog widget can be launched as a
stand-alone application with the following command:
taurustrend2d <array_attribute_name>
Run the following command for more details:
taurustrend2d --help